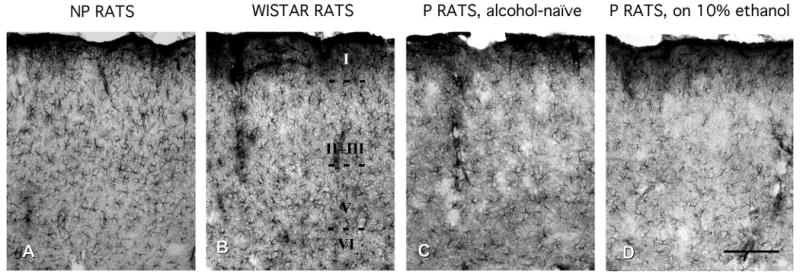
Fig. 1.

Micrographs illustrating the pattern of GFAP immunoreactivity in the PLC of NP rats (A), Wistar rats (B), alcohol-naive P rats (C), and P rats exposed to 10% ethanol for 2 months (D) show visible lower packing density of GFAP-IR astrocytes in P rats than in NP rats and Wistar rats. (B) Roman numerals (I, II, III, V, and VI) correspond to the cortical layers. (D) Calibration bar is valid for the four panels, 200 μm.
