
Fig. 3.
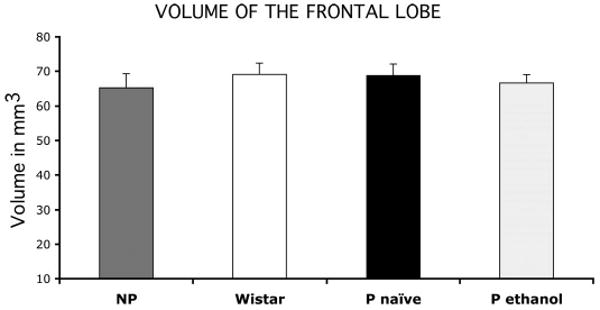
Bar graphs representing the volume of the rat frontal lobe from its rostral tip to the beginning of the corpus callosum in NP rats, Wistar rats, alcohol-naive P rats, and P rats exposed to 10% ethanol for 2 months. Whiskers on the bars represent SEs.