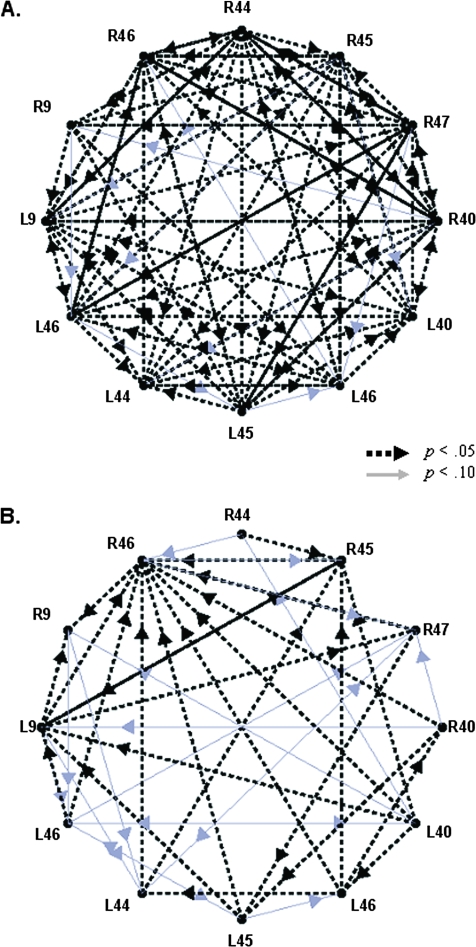
Figure 3.
Results of the GCAs for the vigilance task (A) and for the DSST task (B). For both tasks, the results are arranged in a circular fashion with rostral information represented on the left side of each circle, relatively ventral and posterior regions are illustrated in the middle portions so that the caudal-most ROIs are on the right side of the circle. Arrows indicate significant influences; thicker black and dashed arrows represent influences with P < 0.05; thinner gray arrows represent influences with 0.05 < P < 0.10.

