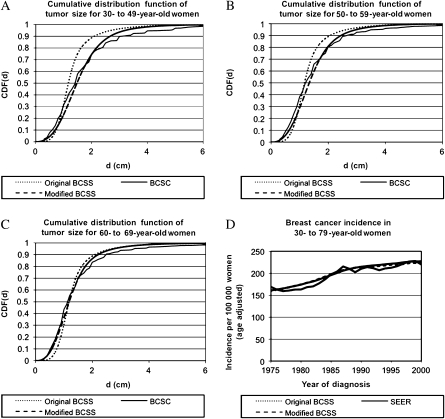
Figure 1.
Calibration of Breast Cancer Screening Simulator (BCSS). Cumulative distribution function, CDF(d), of tumor size (diameter) at screen detection (d), for women aged A) 30–49 years, B) 50–59 years, and C) 60–69 years. The solid curve (labeled “modified BCSC”) corresponds to data obtained from the Breast Cancer Surveillance Consortium (BCSC); long dashed curve (labeled “modified BCSS”) corresponds to the modified BCSS that used age-specific median mammography thresholds (MTs) and mean doubling times (DTs); short dashed curve (labeled “original BCSS”) corresponds to the original BCSS that used non–age specific median MTs and mean DTs (15). D) Breast cancer incidence rate (per 100 000 women), age adjusted to US standard population in the year 2000. The solid curve (labeled “SEER”) corresponds to data obtained from the Surveillance, Epidemiology, and End Results (SEER). Patients with ductal carcinoma in situ alone were excluded from the analyses (A–D).

