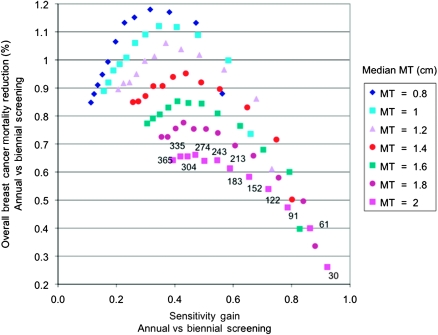
Figure 4.
Scatter plot showing overall breast cancer mortality reduction vs sensitivity gain in women aged 40–49 years when comparing annual vs biennial screening for women aged 40–49 years with annual screening for women aged 50–69 years. For a mammography threshold (MT) of 2 cm, the mean doubling time is shown in days (30–365); the sequential ordering of mean doubling time is the same for all values of the median MT.

