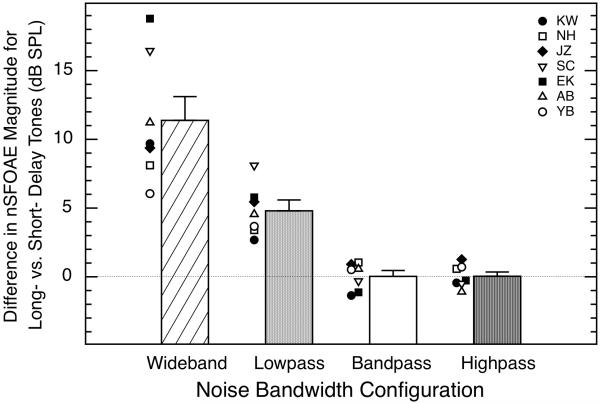
Fig. 5.
Differences in nSFOAE magnitudes for long-delay (200-ms) and short-delay (5-ms) tones plotted as a function of noise bandwidth. Bars indicate averages across all seven subjects, and symbols indicate individual data in each condition. The noise bandwidths were: 0.1 – 6.0 kHz (wideband), 0.1 – 3.8 kHz (lowpass), 3.8 – 4.2 kHz (bandpass), and 4.2 – 6.0 kHz (highpass); for all bandwidths, the spectrum level of the noise was 25 dB. Error bars indicate one standard error of the mean difference. For the highpass and bandpass noises, there was no rising, dynamic response to noise onset, and the responses to the short- and long-delay tones were essentially the same.

