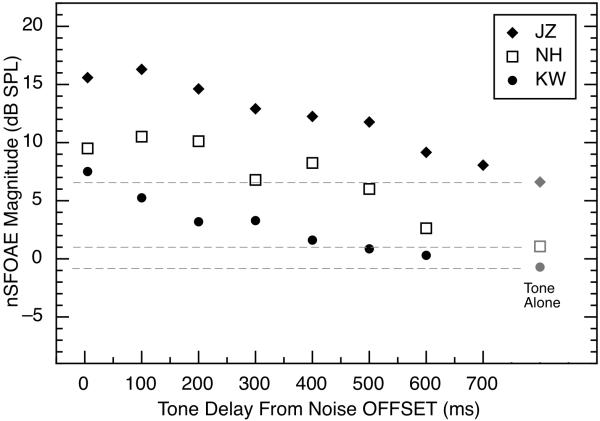
Fig. 6.
Magnitude of the nSFOAE response to brief tones presented at various time delays after the offset of a 200-ms wideband noise (25 dB spectrum level). Tones were 4.0 kHz, 60 dB SPL in level, and 10 ms in duration. The grey symbols at the right and the dashed horizontal lines show the magnitude of each subject’s nSFOAE response to the 60-dB tone presented alone. Recovery to tone-alone levels was much slower than the rise to maximum magnitude shown in Fig. 4. For efficiency, these data were collected in blocks of trials in which every stimulus presentation contained two tone delays, always separated by at least 200 ms. The values plotted are the maximum magnitudes of the nSFOAE response to each tone presentation.

