
Figure 3.
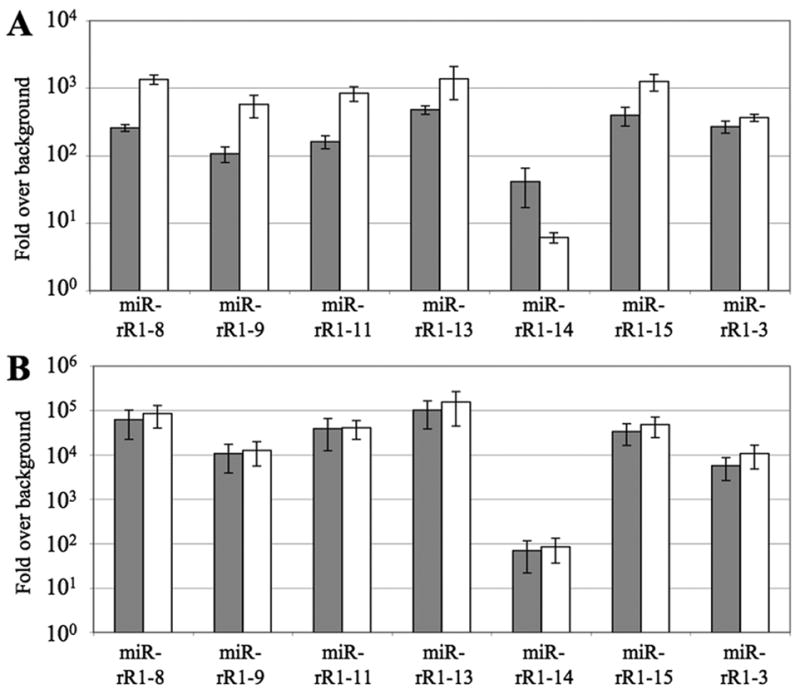
RRV miRNA expression levels determined by qRT-PCR. All values are given as fold-expression relative to an uninfected control sample and are normalized to levels of a cellular miRNA, miR-16. (A) Expression levels of RRV miRNAs in the RF tumor sample (18483; gray) and the B cell lymphoma (19286; white). RNA recovered from RRV-uninfected tissue derived from the same animals served as the negative controls. (B) Expression levels of RRV miRNAs in latently infected MVECs harvested 23 (gray) or 44 (white) dpi. RNA from uninfected MVECs served as the negative control.