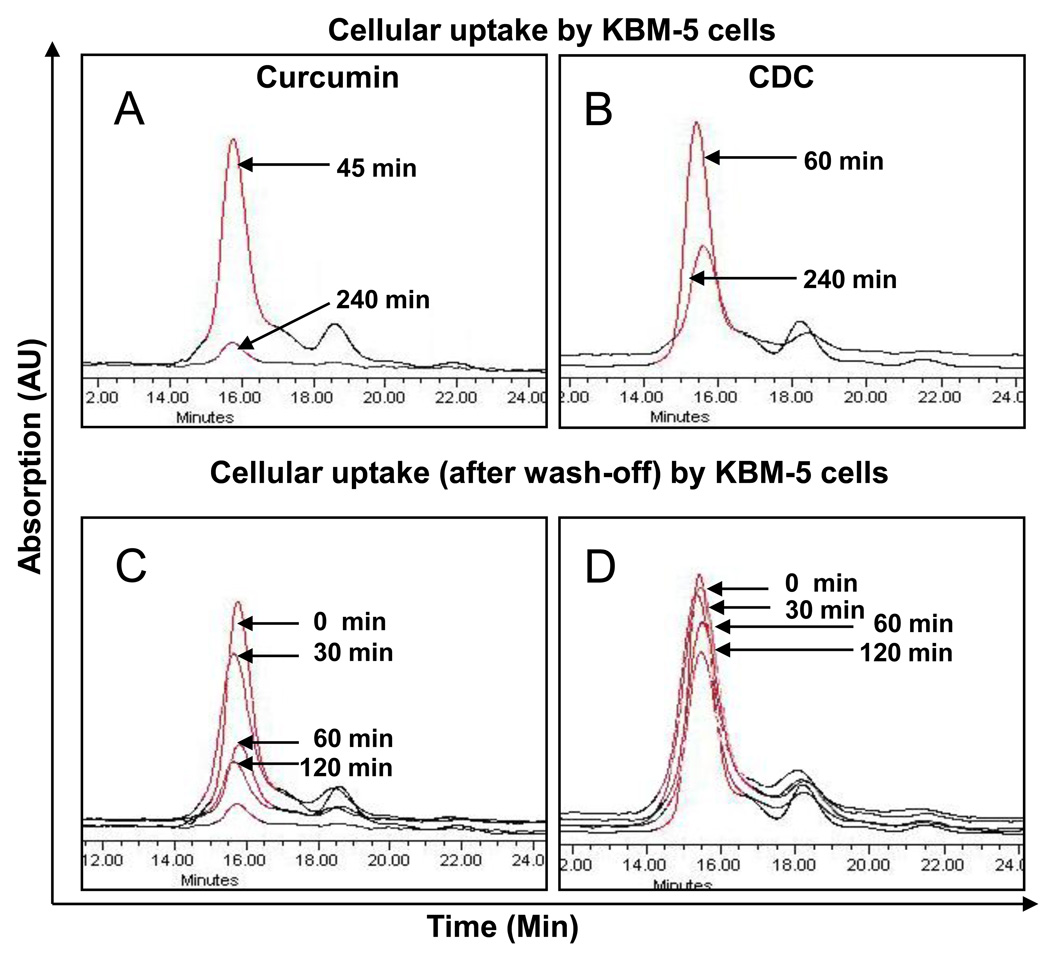
Figure 7.
Overlapped chromatograms of curcumin levels in the cells after treatment with curcumin or CDC. Chromatograms A and B show cellular uptake of curcumin and CDC, respectively, at different time points during treatment with 10µM concentration. Chromatograms C and D show curcumin levels in the cells at different time intervals after wash of the cells. The cell density was 5×10⁶/mL of KBM-5 cells.

