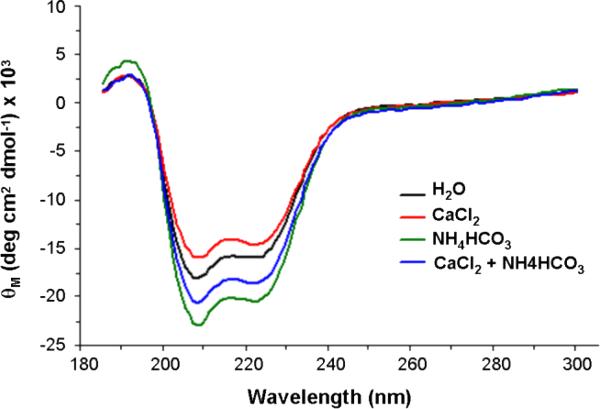
Figure 6. CD spectra of rOC90. The CD spectra were generated by numerical deconvolution analysis.
The spectra indicate prevalence of alpha helical secondary structure, with minima at 208 nm and 222 nm, and one maximum at 192 nm. Exposure to Ca2+ or HCO3- ions induced characteristic changes of the secondary structure of 5 μM rOC90. 7.5 mM Ca2+ (red) causes a slight decrease in alpha helical and increase in beta structure, while 4 mM HCO3- (green) leads to an increase of both alpha and beta structure. Application of Ca2+ and HCO3-1 in combination resulted in an 11.6% increase in alpha helical structure (see Table I).

