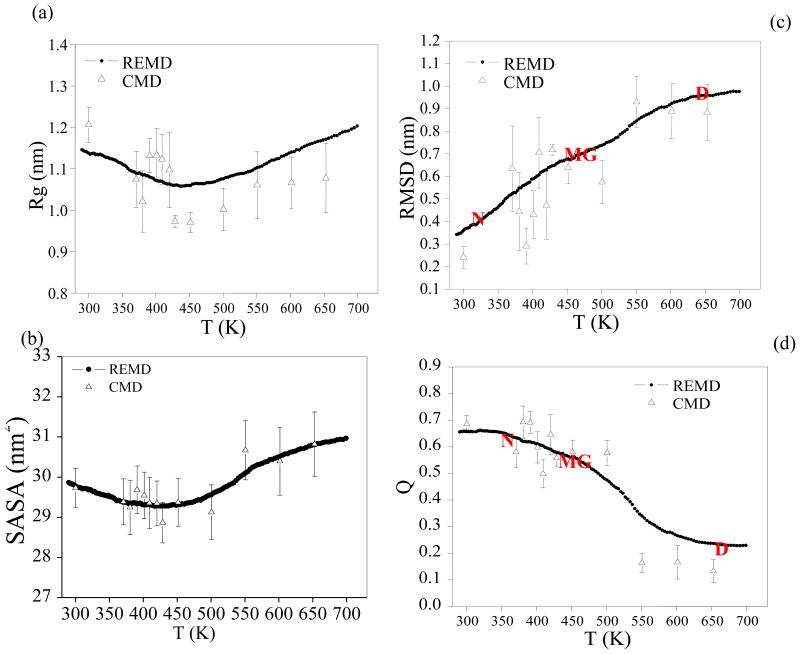
Fig. 3.
Average values of various folding metrics as a function of temperature/simulation time for the REMD simulation and the conventional simulations (CMD). For each conventional simulation and the REMD simulation averaging interval are the final 16 ns of the simulation time. (a) Cα Radius of gyration. (b) Cα SASA (solvent accessible surface area). (c) Cα RMSD from the crystal structure (pdb entry: 1IVO). (d) Q, the fraction of native contacts. Residues are considered in contact when the minimum inter-residue distance of all pairs of heavy atoms is less than 4.2 Å. Native state (N), molten globule state (MG) and denatured state (D) are showed.

