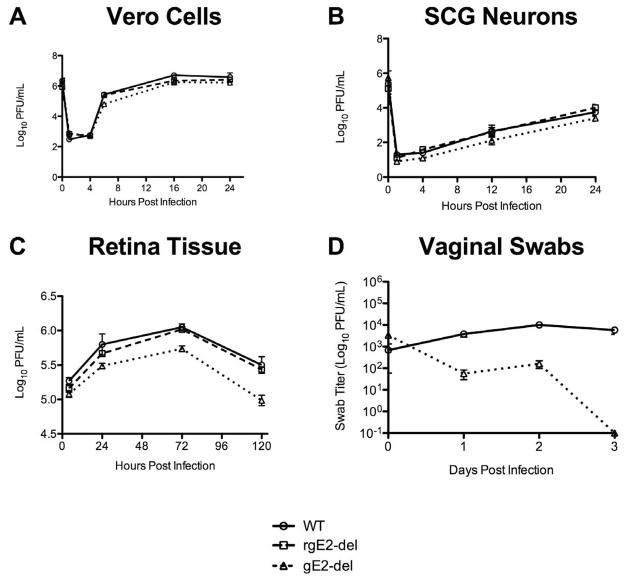
Figure 2.
Single-step growth kinetics of WT, rgE2-del or gE2-del virus. A. Vero cells. Results are the mean of 2 wells per time point. B. Primary embryonic rat superior cervical ganglia neurons. Results are the mean of 4 wells per time point ± SEM. C. Virus replication in retina. Results are the mean of 2 to 3 retinas per time point. D. Virus replication in mice vagina. n=5 mice at each time point ± SEM.

