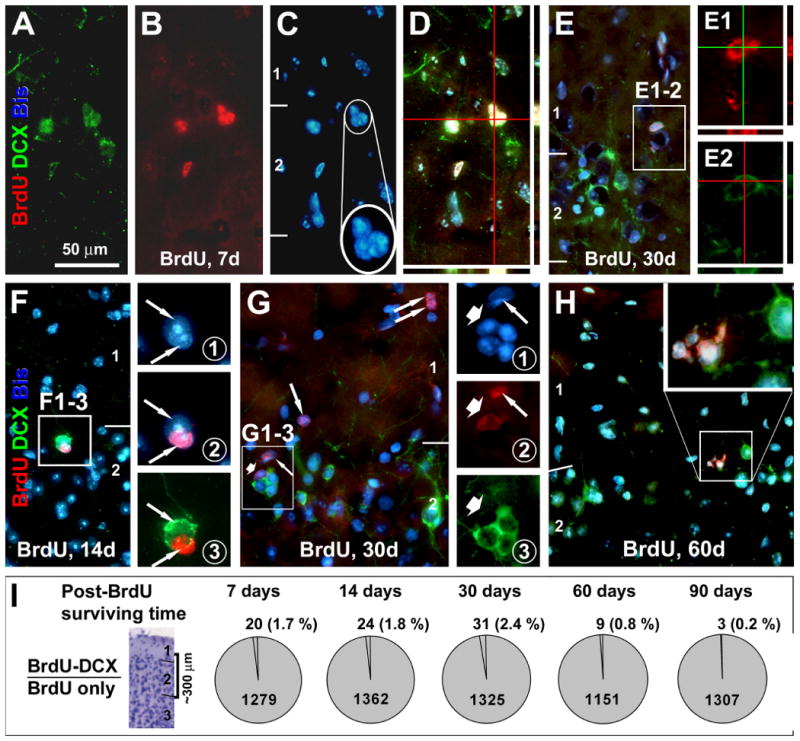
Fig. 3.

Low rate 5-bromodeoxyuridine (BrdU) colocalization in DCX+ cells around layer II at various time points after BrdU administration. Panels (A-D) and (E-E2) show examples of BrdU-incorporated DCX+ cells at the layers I/II border (from animals surviving 7 and 30 days). BrdU reactivity occurs in the nucleus counterstained with bisbenzimide (Bis, blue) across the thickness (6 μm) of the section as verified by confocal Z-score scanning (D, E1, E2). Note that BrdU+/DCX+ cells may appear in clusters (C), and that the double-labeled cells have no or barely-visible dendritic processes (A, E2). Single-labeled BrdU+ cells may occur next to single-labeled DCX+ cells, with their cell bodies tightly apposing to each other seemingly forming the same cluster (F-F3 and G-G3). Also note that BrdU+ cells may occur in pairs or cluster around layers I and II (G), with some appeared to be shrinking or deformed (H). Pie-graphs (I) summarize the percentages of BrdU+/DCX+ relative to total BrdU+ cells at 7-90 surviving days post-BrdU application, based on cell counts over ∼300 μm depth around the junction of layers I and II. Scale bar in (A) = 50 μm applying to main panels (B-H), equivalent to 25 μm in (E1, E2; F1-3 and G1-3) and 12.5 μm in enlarged inserts in (C and H).
