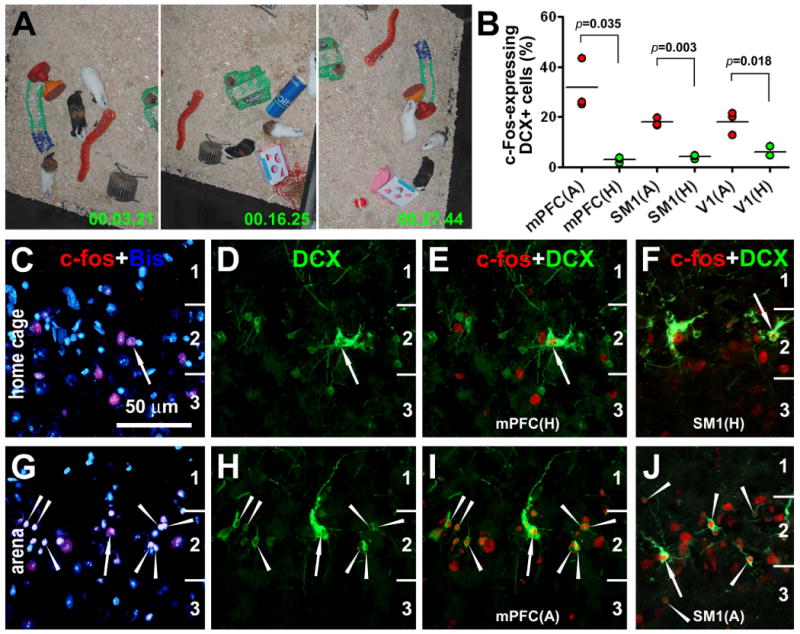
Fig. 7.

c-Fos induction in cortical DCX+ cells in young guinea pigs following novel environmental exploration. Video digital images (A) indicate explorative behavior of the animals during the 30 minute period of exposure to a novel arena. Dot-graph (B) shows an increased rate (%) of c-Fos-expressing DCX+ cells counted in the medial prefrontal (mPFC), primary somatosensory (SM1) and primary visual (V1) cortices in the experimental (A-arena) animals (n=3) relative to home-caged controls (H-home) (n=3) as assessed by students-t tests. Double fluorescent images show examples of c-Fos expression in DCX+ cells around layer II from a home-caged control (C-F) and an experimental animal (G-J). Arrows in (C-J) point to large DCX+ cells with well-developed dendritic and axonal processes, whereas arrowheads indicate small DCX+ cells. Scale bar = 50 μm for all fluorescent images.
