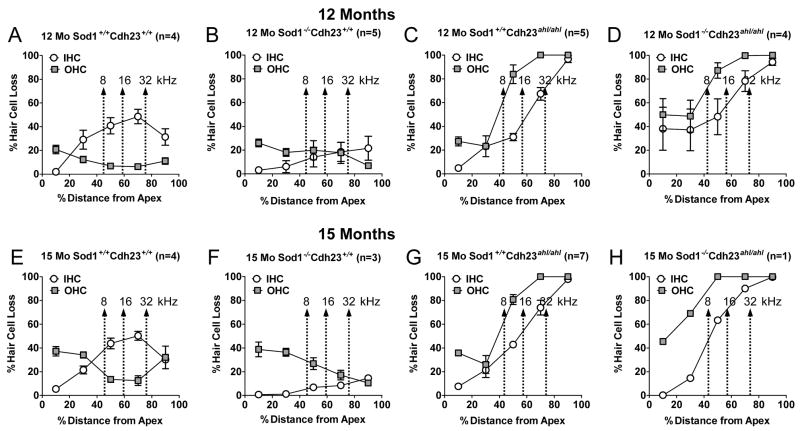
Figure 3. Effects of genotype and cochlear location on hair cell loss.
Cochleograms show the means ± standard errors of the percent IHC and OHC loss in 12 and 15 month old mice for each of the four digenic genotypes of Cdh23 and Sod1, all on a uniform C57BL/6J genetic background. Each point represents the percent hair cell loss in 20% intervals along the cochlear duct. The arrows show the positions along the cochlear place map that correspond to the 8, 16 and 32 kHz test frequencies (Muller et al., 2005).

