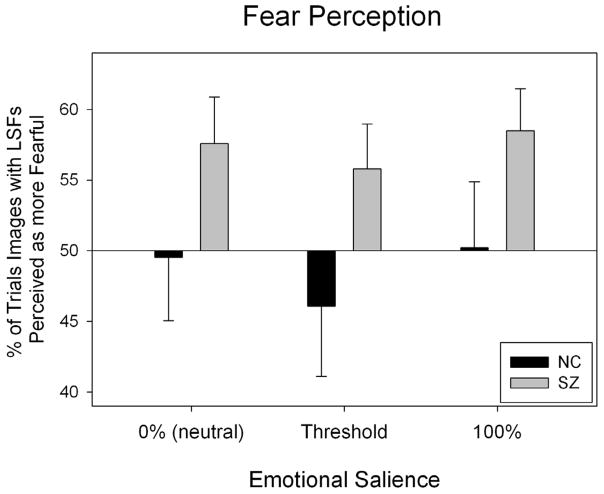
Figure 2.
Patients’ and controls’ perception of images with and without LSFs on the fear perception task. The x-axis denotes the emotional salience of the images being compared, while the y-axis represents the percent of the time images with LSFs were perceived as more fearful than images without LSFs. The horizontal line, a reference of chance level performance (50%), indicates the point at which fear perception of images with LSFs would be identical to fear perception of HSF images. One sample t-tests were used to inspect whether the percentage of the time that individuals perceived HSF, LSF or BSF images as more fearful differed significantly from chance (50%). These analyses were done within each group across salience levels. In patients, images with LSFs were perceived as more fearful (t=3.48, p=0.002), and there was a trend towards perceiving images with HSFs as less fearful (t= −1.87, p=.072). In the control group, no significant effect on spatial frequency was found (p>0.05).

