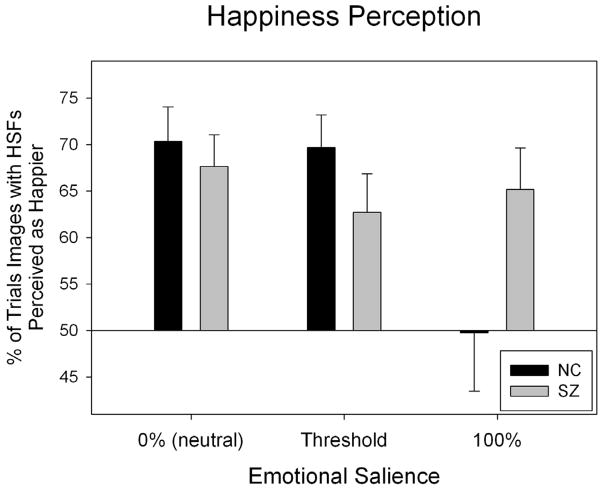
Figure 3.
Patients’ and controls’ perception of images with and without HSFs on the happiness perception task. One sample t-tests assessed each group’s tendency to perceive HSF, LSF or BSF images as happier, and whether this differed significantly from chance (50%). In patients, there were biases to perceive images with HSFs as happier (t=5.11, p<0.001), and images with LSFs as less happy (t= −3.20. p=0.004). Similar biases were found in controls (images with HSFs: t=3.83, p=0.001; images with LSFs: t= −3.06, p=0.005).

