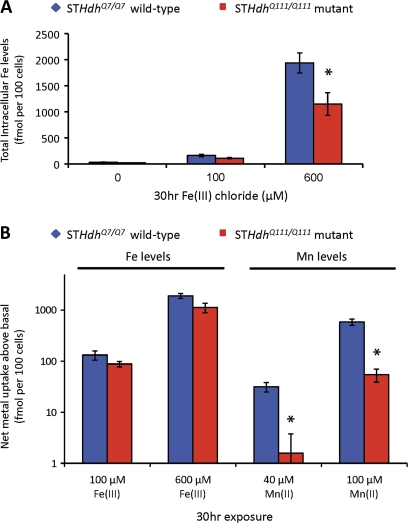
FIG. 4.
Net Fe uptake is reduced in the HD striatal cells. (A) Measurement of total intracellular Fe levels in STHdhQ7/Q7 or STHdhQ111/Q111 striatal cell lines (as indicated) after application of the indicated concentrations of Fe(II) chloride for 30 h (n = 3 to 5). Mean values (±SEM) are plotted on a linear scale. (B) Comparisons of net Fe uptake versus net Mn uptake above basal levels (vehicle control) in STHdhQ7/Q7 (blue) versus STHdhQ111/Q111 (red) cells following a 30-h exposure to these metals. Calculations are derived from Fe data in (Fig. 4A) and previously published Mn data (Williams et al., 2010). Data expressed as the absolute difference (±SEM) between metal-exposed and vehicle-exposed cells (n = 3–5), plotted on log10 scale. “*” Indicates a significant difference in net metal uptake (p < 0.05, using 95% confidence intervals) between wild-type and mutant cells.

