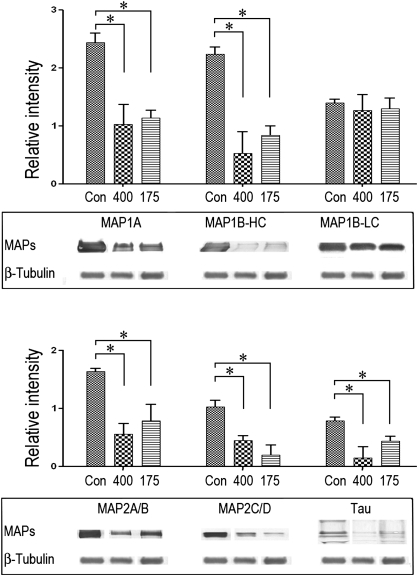
FIG. 3.
Representative immunoblots are presented for MAPs in P3 pellets of AMPPNP microtubule preparations from control and HD (400 and 175 mg/kg/day)-intoxicated rats. Proteins were loaded onto gels at 0.25–20 μg per lane. Band intensities of the immunoblot data were quantified and normalized to ß-tubulin. Data are presented graphically as mean relative intensity (± SEM), and statistical differences between control and intoxicated group mean data are indicated by the connecting lines (*p < 0.05). The corresponding immunoblots from supernatant preparations did not reveal HD-induced changes in protein distribution (data not shown).

