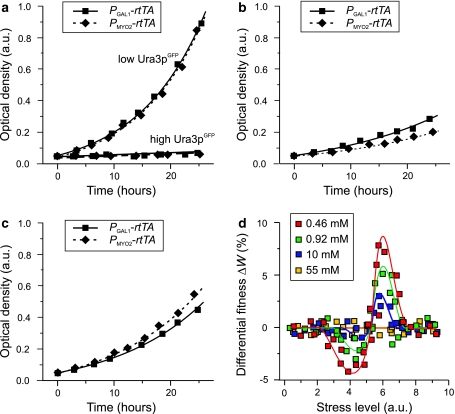
Fig. 5.
Impact of elevated extrinsic noise at different levels of stress. a–c Growth curves for the P GAL1-rtTA strain (high noise) and the P MYO2-rtTA reference strain (low noise). Both strains were grown in synthetic minimal media containing 0.46 mM gal and 500 μg/ml FOA with variable dox concentrations to achieve similar mean URA3 GFP expression levels. Solid curves were obtained from estimated doubling times. a Growth curves when expression is very high or very low, corresponding to severe and no stress, respectively. b Growth curves when expression is relatively high (high stress). c Growth curves when expression is relatively low (low stress). d Differential fitness calculated from measurements of strain doubling times for four different gal concentrations and varying levels of URA3 GFP expression (see text). Solid curves highlight trends in the data

