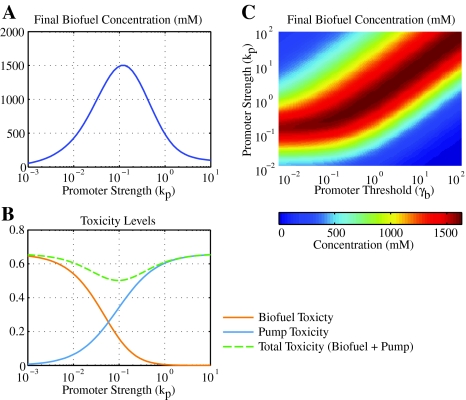
Fig. 5.
Toxicity tradeoffs in biofuel production. a Final biofuel concentration (b e(T); T = 100 h) as a function of promoter strength for constitutive pump expression. b Toxicity of biofuel (orange line) and pumps (blue line) at time T is defined by δn b i(T) and αn p(T)/(p(T) + γp), respectively. The sum of the two toxicity curves is also shown (dashed line). Note that the maximum b e(T) in a occurs at the minimum of the total toxicity curve. c Biofuel production as a function of promoter strength and threshold for a biofuel-responsive promoter. Parameters are the same as in Fig. 3 unless noted

