Figure 4.
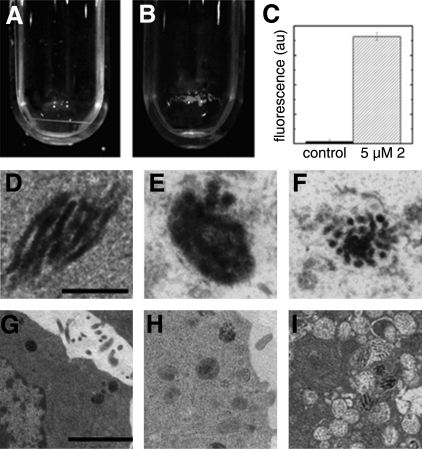
A, B) Fluorescence of bacteriochlorin 2 inside isolated melanosomes from pigmented B16F10 cells. A) Melanosomes from control cells. B) Melanosomes containing 5 μM bacteriochlorin 2. C) Fluorescence quantification of bacteriochlorin 2 in melanosomes. D–I) Transmission electron micrographs showing bacteriochlorin-mediated PDT destruction of melanosomes. D, G) Control, non-PDT-treated melanosome. E, H) Melanosomes 0.5 h after PDT. F, I) Melanosomes 1 h after PDT. Scale bars = 100 nm (D–F; ×15,500); 1 μm (G–I; ×1550).

