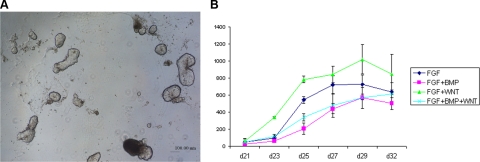
Figure 2.
Formation of lentoid bodies from human ES cells. A) Visualization of lentoid body formation by phase contrast microscopy (×40) at d 35. B) Quantitative analysis of lentoid body formation. Analysis was performed from d 21 to 32. Results are shown as means ± sd from 3 independent experiments. Cultures using BMPs, Wnt-3a, and BMPs/Wnt-3a did not stimulate lentoid body formation (data not shown).

