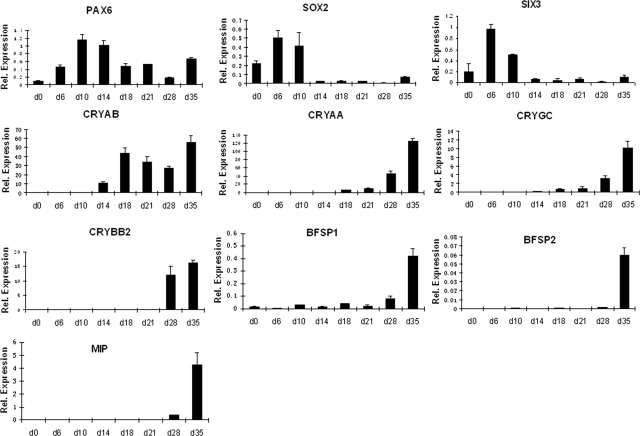
Figure 4.
Quantitative RT-PCR analysis of 10 lens differentiation markers (PAX6, SOX2, SIX3, CRYAB, CRYAA, CRYGC, CRYBB2, BFSP1, BFSP2, and MIP) from d 0 to 35. Results were calculated relative to the average Ct value of B2M, GAPDH, and SDHA genes, as described in Materials and Methods, and are shown as means ± sd from 3 independent experiments.

