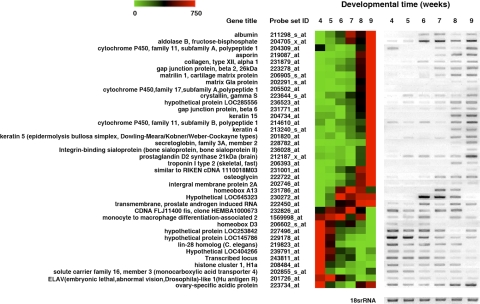
Figure 1.
RT-PCR analysis validated the findings from the microarrays. RT-PCR analysis was performed for 38 regulated genes. The results appear to the right of the microarray data for each gene. The color scale at top left indicates the relative levels of expression. Red and green indicate high and low expression levels, respectively. 18S rRNA was analyzed as a loading control.

