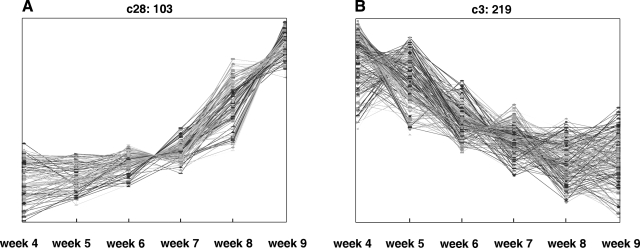
Figure 2.
SOM cluster analysis of the developmentally regulated genes. Of the 42 clusters, 2 are shown here as examples. The heading of each panel indicates the index of the cluster in the full SOM, followed by the number of genes in the cluster (Supplemental Fig. 1). A) Genes whose expression increased throughout the developmental period (cluster c28 with 103 genes). B) Genes whose expression decreased throughout the developmental period (c3 with 219 genes).

