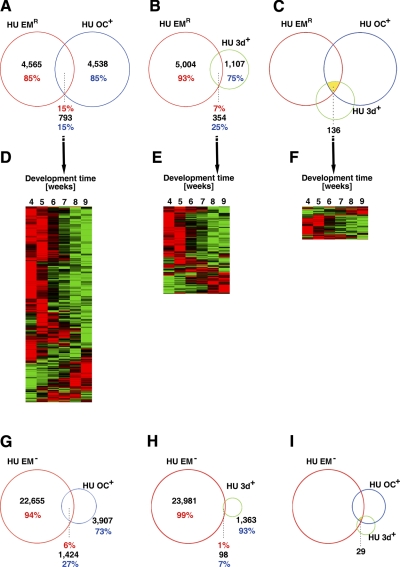
Figure 3.
Venn diagrams showing that a number of genes that are highly expressed in human oocytes and 3-d-old embryos are repressed during wk 4–9. A, B) Venn diagrams between genes whose expression changed significantly during wk 4–9 of human embryogenesis (HU EMR) and genes that were highly expressed in the human oocyte (HU OC+) (A) or in 3-d-old human embryos (HU 3d+) (B). C) Venn diagram showing genes regulated during wk 4–9 that were also highly expressed in the oocyte and 3-d-old embryo. D, F) The expression profiles of the common genes in A–C, respectively. Note that the expression of the majority of the genes was repressed by wk 9. Red and green indicate high and low expression levels, respectively. G, H) Venn diagrams between genes with no detectable expression during wk 4–9 and genes highly expressed in human oocyte (G) or 3-d-old embryos (H). I) Venn diagram showing genes with no detectable expression during wk 4–9 but high levels of expression in the oocyte and 3-d-old embryo.

