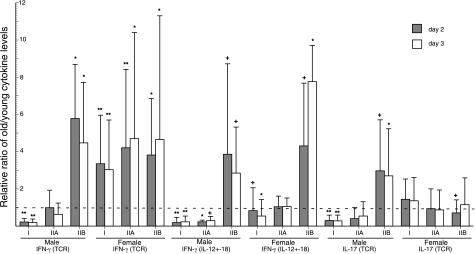
Figure 3.
Relationships between immune-inflammatory status and the old-young ratios of generation of IFN-γ and IL-17 by T cells of subjects in groups I, IIA, and IIB. Stimuli, conditions, meanings of each type of column and bar, and statistical method and symbols denoting statistical significance of increases above and decreases below a ratio of 1 (no difference between age groups) are the same as in Fig. 2.

