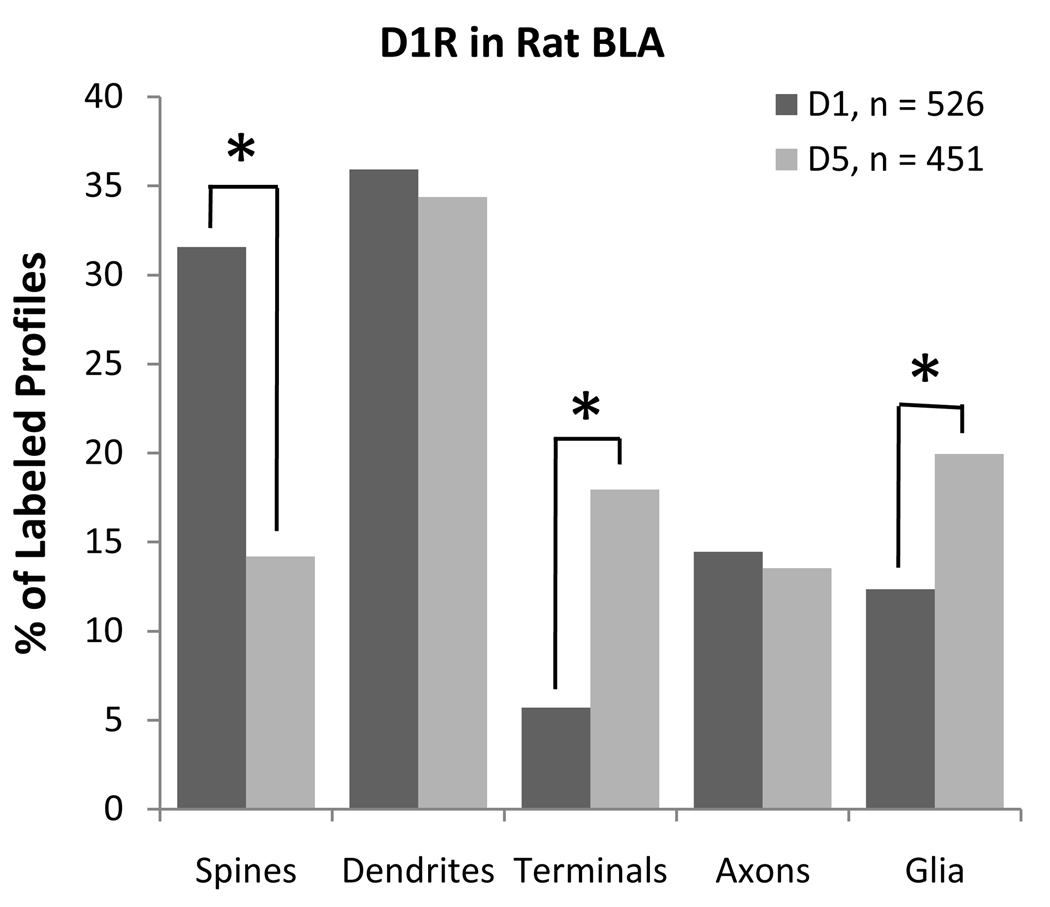
Figure 15.
A histogram comparing the relative abundance of D1 and D5 in the BLA of the rat. The distribution of D1 and D5 differed significantly (χ2= 2.371; p<0.0001). Post-hoc testing revealed that dendritic spines were more commonly labeled for D1, while axon terminals glia were more commonly labeled for D5. Comparisons that are significantly different by post-hoc tests are indicated by an asterisk.

