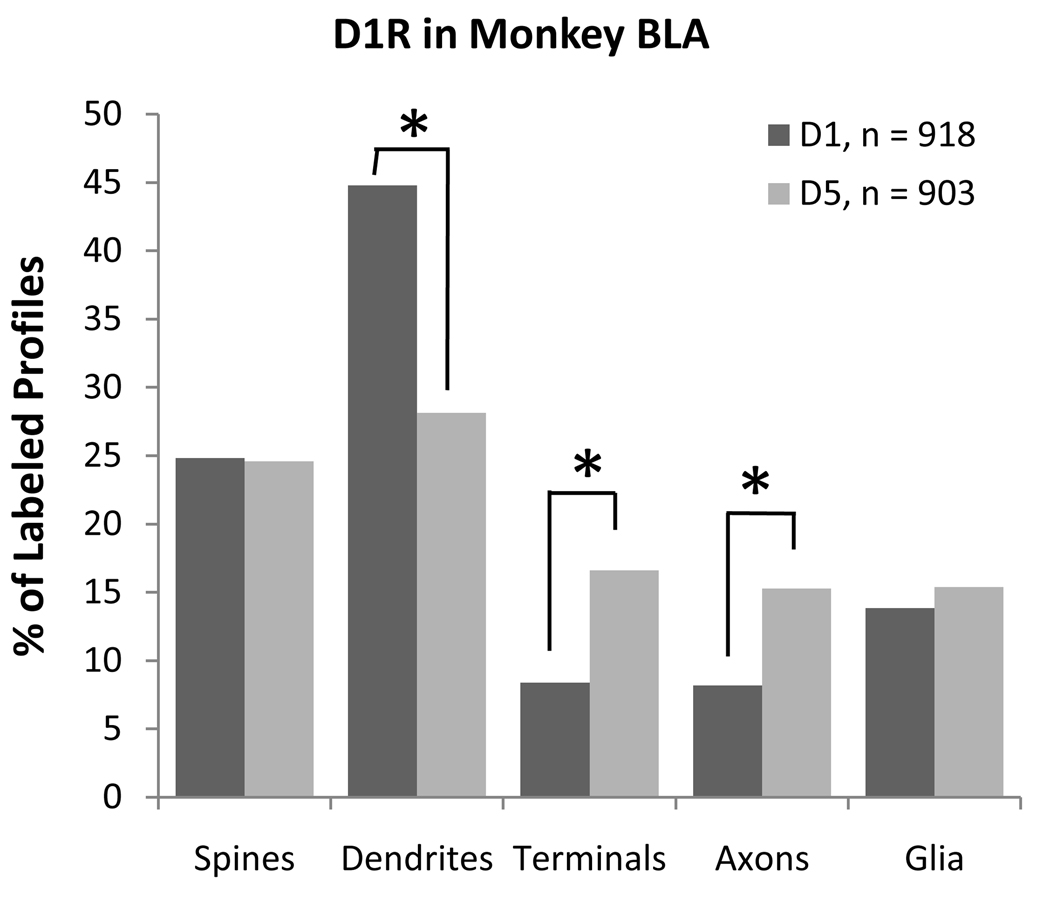
Figure 6.
A histogram comparing the relative abundance of D1 and D5 in the BLA of the rhesus monkey. The distribution of D1 and D5 differed significantly (χ2= 79.679; p<0.0001). Post-hoc testing revealed that dendritic shafts were more commonly labeled for D1, while preterminal axons and axon terminals were more commonly labeled for D5. Comparisons that are significantly different by post-hoc tests are indicated by an asterisk.

