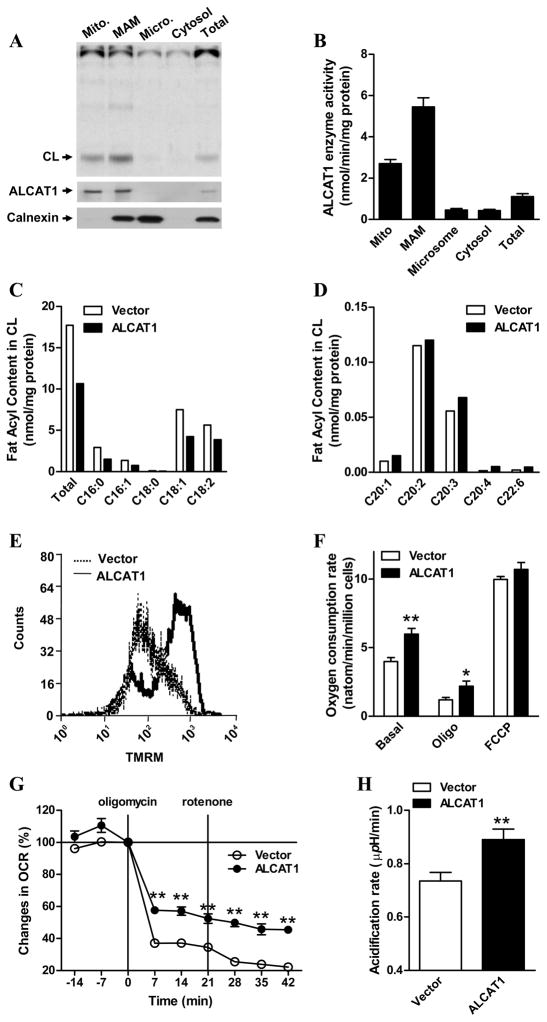
Figure 1. ALCAT1 is localized at the mitochondria-associated membrane (MAM) where it catalyzes remodeling of CL that leads to mitochondrial dysfunction.
A, COS-7 cells overexpressing the flag-tagged ALCAT1 protein were fractionated into mitochondria (Mito), MAM, microsomes (micro), and cytosolic fractions. Monolyso-CL acyltransferase activity was analyzed from each fraction by TLC analysis, and quantified (B). ALCAT1 and calnexin (an ER marker) levels in each fraction were analyzed by western blot analysis (bottom panels). C, lipidomic analysis of total CL and the C16–18 acyl content in CL, or D, the long chain polyunsaturated acyl content in CL, from C2C12 cells stably overexpressing ALCAT1 (filled bar) or an empty vector (open bar) by negative-ion electrospray ionization mass spectrometry. The C2C12 cells stably overexpressing ALCAT1 or vector were also analyzed for E, mitochondrial membrane potentials by flow cytometry; F, oxygen consumption rate (OCR) by oxygraph; and G, proton leakage as measured by changes in OCR after sequential treatment with oligomycin and rotenone, which was profiled by Seahorse XF-24 analyzer and expressed in % of basal line. H, up-regulation of glycolytic activity by ALCAT1 overexpression in C2C12 cells as evidenced by higher acidification rate of the culture medium measured by the XF-24 analyzers. N=3. *P < 0.05, ** P < 0.01.

