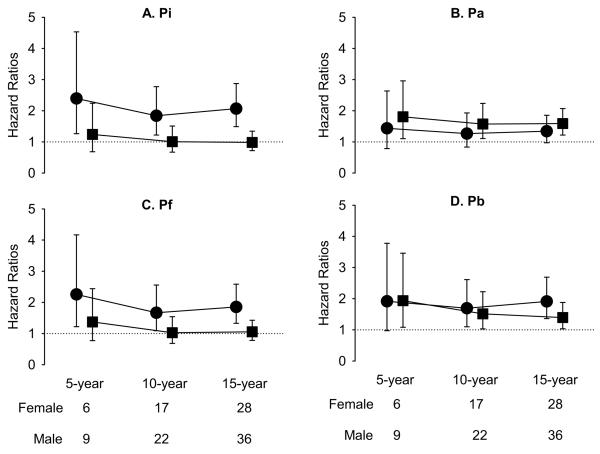
Figure 3.
Hazard ratios per increment of one-standard deviation of Pi (A), Pa (B), Pf (C) and Pb (D) for 5-year, 10-year and 15-year cardiovascular mortality, accounting for age, heart rate, and height. Circles indicate women and squares indicate men.
Abbreviations are the same as for Figure 2.

