
Figure 1.
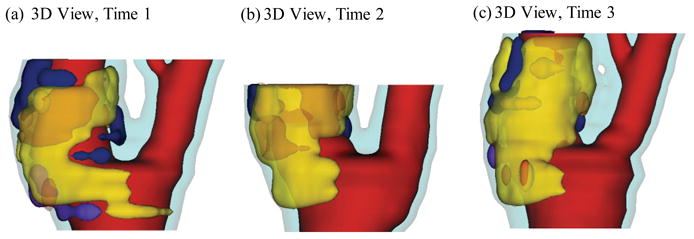
Re-constructed 3D geometry of a carotid plaque based on in vivo serial MRI data. Three time point data are shown. T1, T2 and T3 refer to time points from here on, unless otherwise indicated. Scan interval: T1–T2, 642 days; T2–T3, 519 days. Red – lumen; Cyan-outer wall; Yellow - necrotic core; Fresh red - hemorrhage in necrotic core); Purple - loose matrix; Dark blue – calcification; Green - fibrous cap.