
Figure 3.
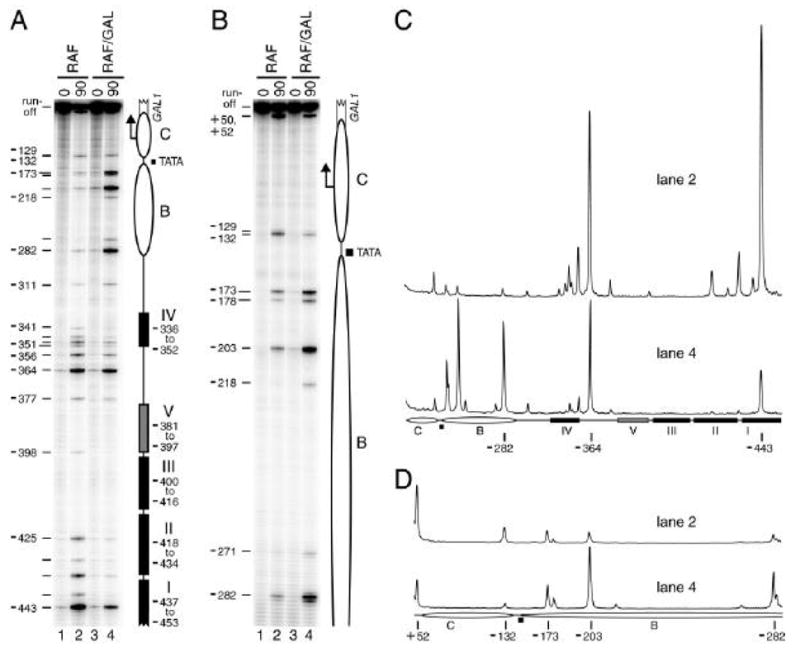
MAP analysis of the non-induced and induced GAL1 promoter. Cells grown under non-inducing (CSM-raffinose, RAF, lanes 1 and 2) or inducing conditions (CSM-raffinose plus galactose, RAF/GAL, lanes 3 and 4) were subsequently left untreated (0 min, lanes 1 and 3) or treated with 100 nM E2 for 90 min to induce M.CviPI synthesis (lanes 2 and 4). The bisulfite sequencing results are shown in the phosphorimages (A, B) or respective quantitative scans (C, D) of the indicated lanes. Improved resolution of bands near the top of the gel in A was obtained by re-extension with an internal primer (i.e. walking) in B. Ellipses, positioned nucleosomes B and C; filled rectangles, Gal4 binding sites I–IV; gray rectangle, Gal4 binding site V (detected previously only by photoaffinity footprinting [43]); filled square, TATA box; bent arrow, major transcription initiation site; and open broken rectangle, GAL1 coding sequence. Nucleotide distances of cytosines in select GpC sites relative to the GAL1 ATG translation start codon are indicated at the left of each phosphorimage and below each pair of scans.