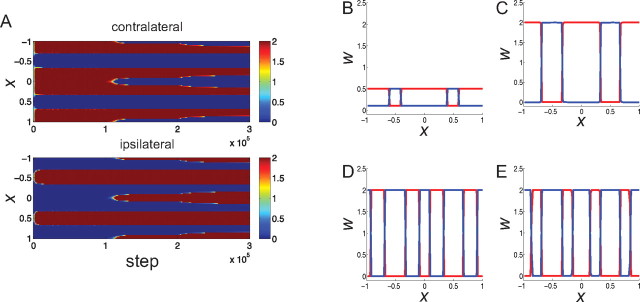
Figure 2.
The evolution of synaptic weights using a Hebbian learning rule with subtractive weight normalization (Eq. 6). A, The evolution of synapses carrying information from the contralateral (top) and ipsilateral (bottom) eye. Synaptic strengths are shown as color, ranging from zero (blue) to maximal (dark red). Vertical axis is position along the one-dimensional cortical grid. Horizontal axis is time: the CP starts at time 1 (105 iterations), and MD of the contralateral eye is initiated at time 2 (2 × 10⁵ iterations). B–E, Snapshots of the synaptic strengths from the contralateral eye (red) and from the ipsilateral eye (blue) at different times: initial state, time 0 (B); before CP, time 1 (C); during CP but before MD, time 2 (D); and after MD, time 3 (E). Vertical axis, Synaptic strength; horizontal axis, position along the cortical grid.

