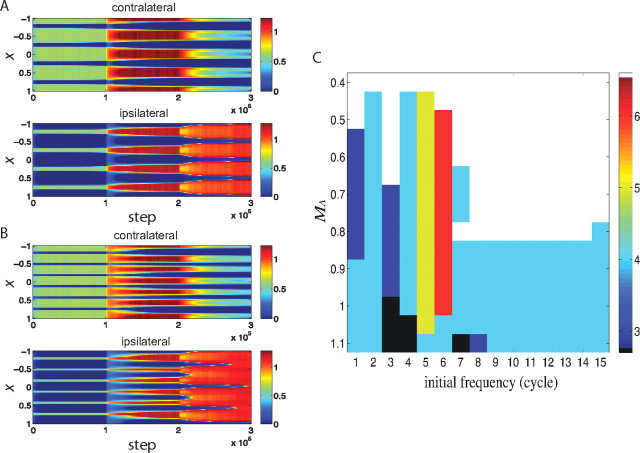
Figure 6.
The spacing of ocular dominance columns is determined also by the initial condition: the evolution of synaptic weights with the Hebbian-plus-homeostatic learning rule of Equation 7, starting from an intermediate (4 cycles; A) or high (6 cycles; B) spatial frequency pattern of initial synaptic strengths. The evolution of synapses carrying information from the contralateral (top) and ipsilateral (bottom) eye, shown as color, versus time (horizontal) and position (vertical). C, The final spatial frequency (in cycles) of the ocular dominance columns, shown in color, as a function of the spatial frequency of the initial condition and the strength of the intracortical connections, MA. The peak of the power spectrum of the function M, which describes intracortical connections, peaked at ∼4 cycles. The spatial frequency of the final OD column was close to the spatial frequency of the initial weight pattern when MA was not too large and when the spatial frequency of the initial weight pattern was three to six cycles close to the four-cycle spectrum peak of M; otherwise the frequency of the final OD columns was set by the spectrum peak of M. (For better spatial resolution, N = 400 neurons were simulated instead of N = 100 in this panel.) The cortex did not equalize (the synaptic strength from one eye exceeded 60% of the total) within the simulation time when MA was too small (shown as white color). The cortex equalized before the maturation of inhibition when MA was too big (shown as black).

