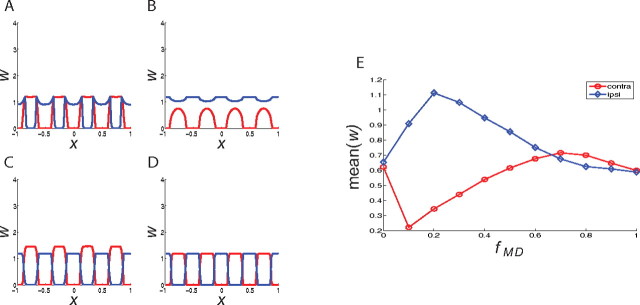
Figure 7.
The synaptic strengths from the contralateral eye (red) and the ipsilateral eye (blue) after MD using the Hebbian-plus-homosynaptic plasticity rule. The figure shows the results for different values of fMD: 0 (A), 0.2 (B), 0.8 (C), and 1 (D). E, The mean strength of the open-eye (ipsi) and closed-eye (contra) synapses after MD for differing values of fMD during MD.

