
Figure 8.
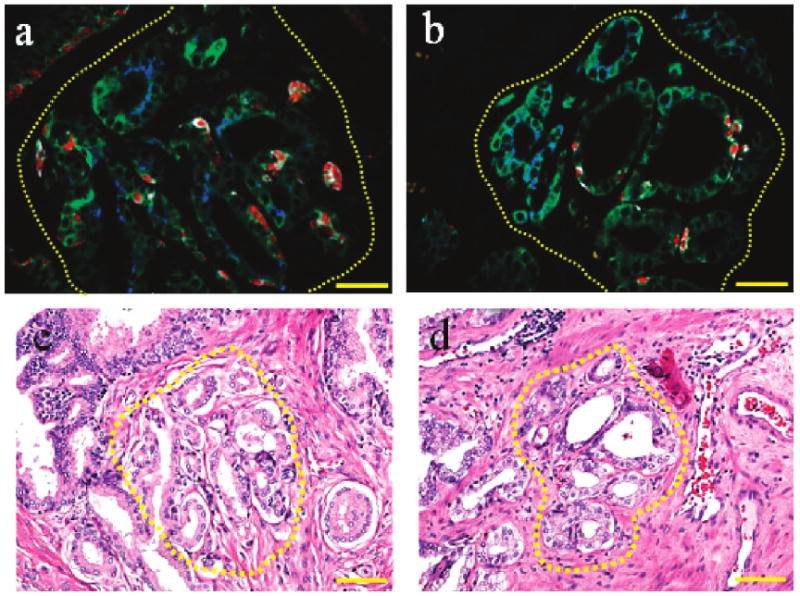
Comparison of multiplexed QD mapping (a,b) and traditional H&E staining images (c,d) for two histopathologically complex foci on adjacent prostate cancer tissue sections. The dashed circles in images a and c correspond to one complex region, and the dashed circles in images b and d correspond to another complex region. In panels a and b, objective = 40×, scale bar = 50 μm. In panels c and d, objective = 20×; scale bar = 100 μm.