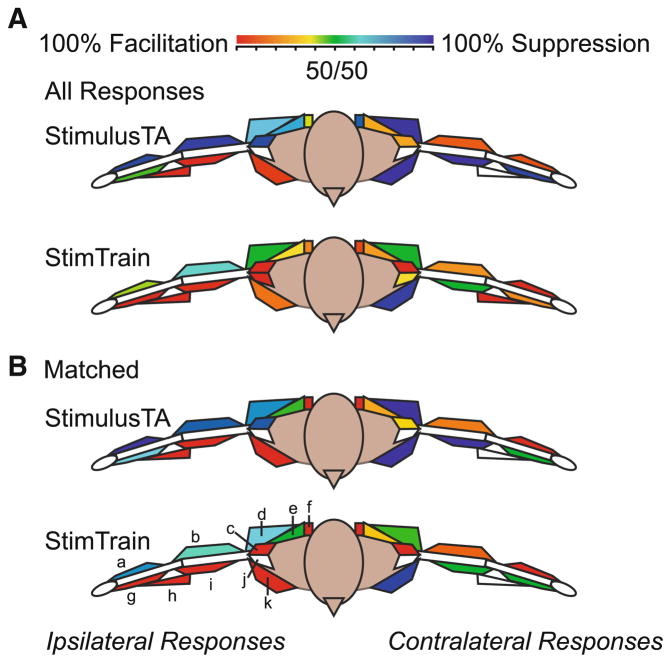
Fig. 4.
This schematic representation color codes muscles according to the proportion of facilitation versus suppression for each stimulation method. As shown in the key, shades of red indicate muscles that were mostly facilitated, shades of blue indicate muscles that were mostly suppressed, and colors in between represent a mixture of responses; white no response. Responses are referred to as ipsilateral or contralateral to the stimulation site. The top two diagrams a illustrate the response patterns for all control-period StimulusTA and stimulus train results. The bottom two b illustrate the response patterns for all control-period StimulusTA and stimulus train results constrained to sites where both methods evoked responses for a given muscle. In order to portray the triceps muscle, the proportion of responses for TRLA and TRLO were averaged. Muscle key: a ECR, b TRI, c PDLT, d LATS, e UTR, f MDLT, g FCR, h BRACH, i BIC, j ADLT, k PMJ

