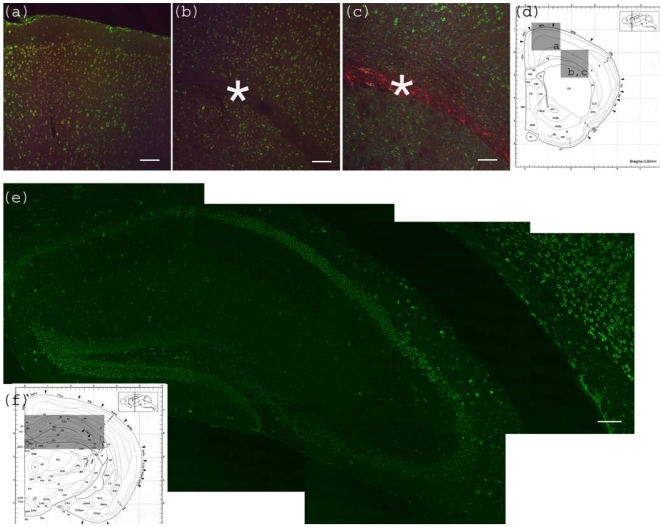
Figure 2.
Anti-Gb3-Ab staining of cerebrum. (a) Motor cortex region showing anti-Gb3 stain (Green) in 2-6 layers of neurons, which are also positive for neuron specific anti-NeuN-Ab (Red). Position of the image corresponding to the Bregma 0.90 mm is shown in (d) as a square. (b) Corpus callosum region of the same section is shown. Astrocyte rich corpus callosum (*) is anti-Gb3 and anti-NeuN negative. Lowerleft area to corpus callosum is striatum (CP). Note that neurons of this area are also positive for anti-Gb3 Ab. Bar indicates 100 μm. (c) Corpus callosum region is stained with anti-Gb3-Ab (Green) and anti-GFAP-Ab (an astrocytic marker, Red). Contrast of GFAP (Red) positive layer versus cortex neurons (Green) is clear. Bar indicates 100 m. (d) Coronal architectural positions at Bregma 0.90 mm is shown with indication of images (a), (b) and (c) in squares. (e) Hippocampus region is shown with anti-Gb3-Ab (Green) stain. Neuronal layers of CA1, 2, 3 and dentate gyras are anti-Gb3 positive. Area in (e) is shown as a rectangle in (f). Bar indicates 100 m. (f) Coronal section architecture at Bregma −2.40 mm is shown. (d) and (f) are modified from [23].

