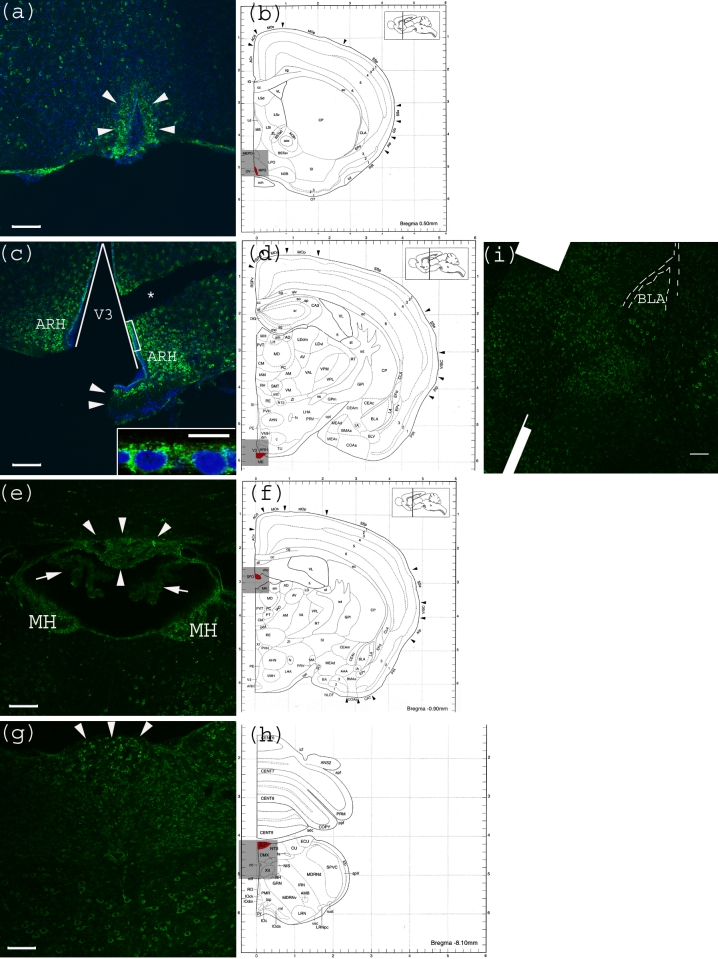
Figure 4.
Anti-Gb3-Ab staining of CVO areas (a) Anti-Gb3-Ab stain (Green) of OVLT region, which is depicted in (b) as Red. Arrowheads indicate the OVLT area; (b) Architectural structure of mouse Bregma 0.50 mm; (c) Anti-Gb3-Ab stain (Green) of a region containing ME, which is depicted in (d) as Red. Arrowheads indicate the ME area. Neurons in ARH, which are adjacent to ME are anti-Gb3-Ab reactive. The V3 is shown as a triangular area. A part of ependymal layer (square region) is shown in inset with higher magnification. (*) indicates a broken tissue space; (d) Architectural structure of mouse Bregma −1.30 mm; (e) Anti-Gb3-Ab stain (Green) of a region containing SFO, which is depicted in (f) as Red. Arrowheads indicate the SFO area, while arrows show anti-Gb3-Ab negative choroid plexus. Neurons of MH are also anti-Gb3-Ab reactive. Lower area of this field includes thalamic nuclei as PVT and MD, in which neurons are positive for anti-Gb3-Ab. (f) Architectural structure of mouse Bregma -0.90 mm; (g) Anti-Gb3-Ab stain (Green) of a region containing AP, which is depicted in (h) as Red. Arrowheads indicate AP area. Neurons of several different nuclei in the medulla oblongata such as NTS, DMX and XII are also anti-Gb3-Ab positive; (h) Architectural structure of mouse Bregma −8.10 mm; (i) Neurons in the amygdala are also anti-Gb3-Ab positive. BLA is indicated in the picture. Dotted line outlines external capsule (ec). See architectural structure in (d). All Bars indicate 100 m, except an inset in (c) which indicates 10 m. Blue color in (a) and (c) indicates nuclei staining using DAPI. (b), (d), (f) and (h) are modified from [23]. See abbreviations in Table 1.

