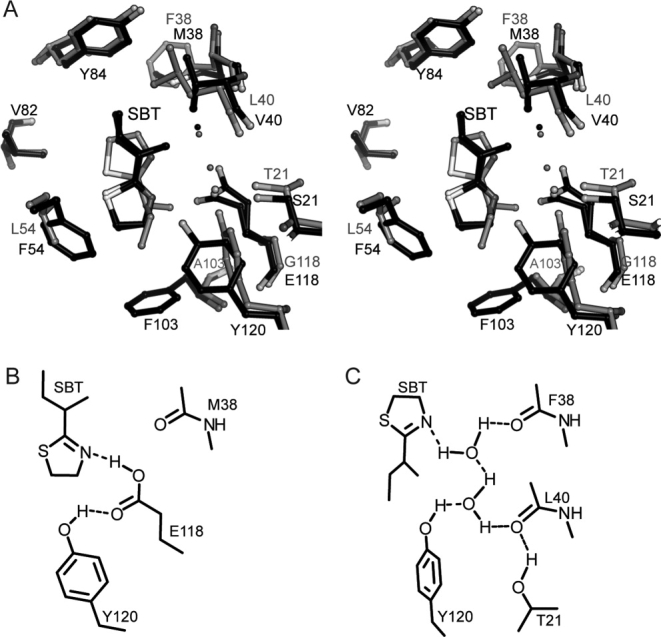
Figure 5.

Details of SBT coordination in MUP-IV versus MUP-I. A. Stereoview of structure overlay, protein backbone atoms aligned. The MUP-IV complex is shown in black and the MUP-I complex (1i06, Ref. 24) is shown in gray ball-and-stick representations. B. Hydrogen bonding diagram for the SBT-MUP-IV complex. C. Hydrogen bonding diagram for SBT-MUP-I complex (1i06) adapted with permission from Figure 4, Ref. 24. For clarity, views are rotated 180° about the vertical, relative to Figure 4.
