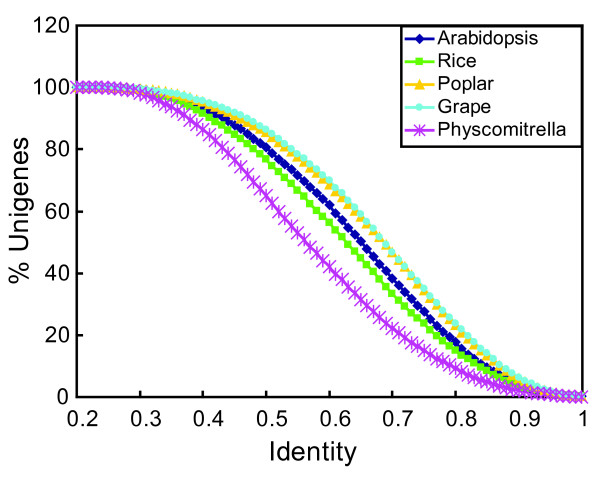
Figure 3.
Cumulative count curves of identity between S. hermonthica unigenes and those from other plant species. All the sequenced S. hermonthica unigenes were used in blastx or tblastx searches against the peptide databases of the indicated plant species. The curves represent the percentages of S. hermonthica unigenes that showed higher levels of identity than the values on the x-axis.

