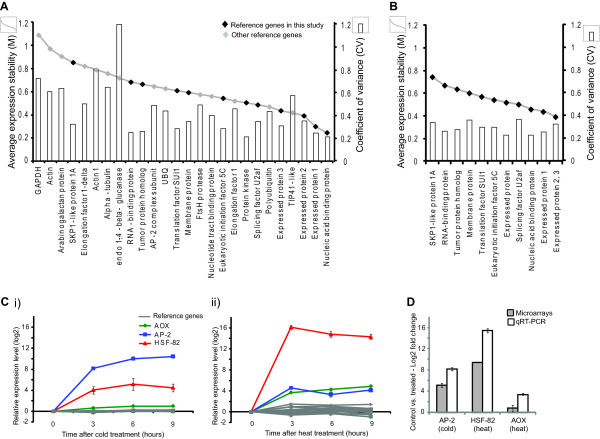
Figure 3.
QRT-PCR validation of proposed reference genes and comparison to previously suggested/commonly used reference genes. A) geNORM output using QRT-PCR data showing average expression stability values of all commonly used and novel reference genes, lower M value indicates greater stability. The coefficient of variance for each gene across all the microarrays is also shown, lower CV indicates greater stability. Genes with low M value and low CV are the most stable. Genes not expressed in all microarrays are indicated with an asterisk (*). B) Transcript abundance of the 12 reference genes identified in this study (indicated in grey) and AP-2, HSF-82 and AOX in shoots from the (i) cold and (ii) heat treated (as indicated) seedlings over time. C) Comparison of the change in AP-2, HSF-82 and AOX transcript abundance (log2 fold change) in the leaves from the 3 h cold and heat treated (as indicated) seedlings compared to the control seedlings using microarrays and QRT-PCR.

