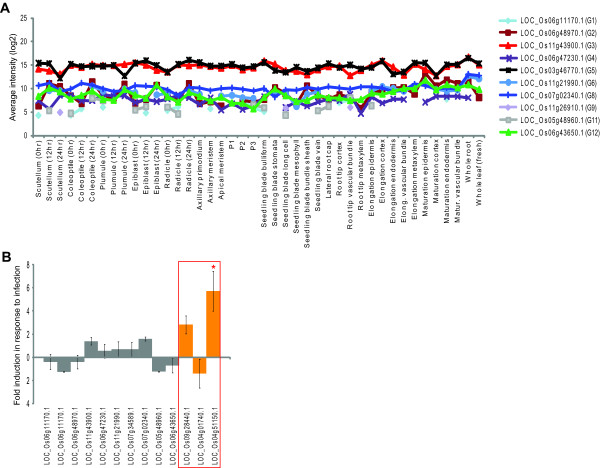
Figure 4.
Expression of the proposed reference genes using other platforms. A) Transcript abundance levels for the 12 proposed references genes based on data using the Rice Yale/BGI oligonucleotide microarray. The average intensity (using >2 replicates) were log2 transformed and visualised across the tissues analysed in a previous study [22]. B) Change in transcript abundance for the 12 proposed reference genes (grey) and AP-2, HSF and AOX (red box) following infection with hemibiotrophic fungus Magnaporthe oryzae [24]. Absolute fold-change values are shown (+/- standard error). Significant changes (t-test, p < 0.01) are indicated by a red asterisk.

