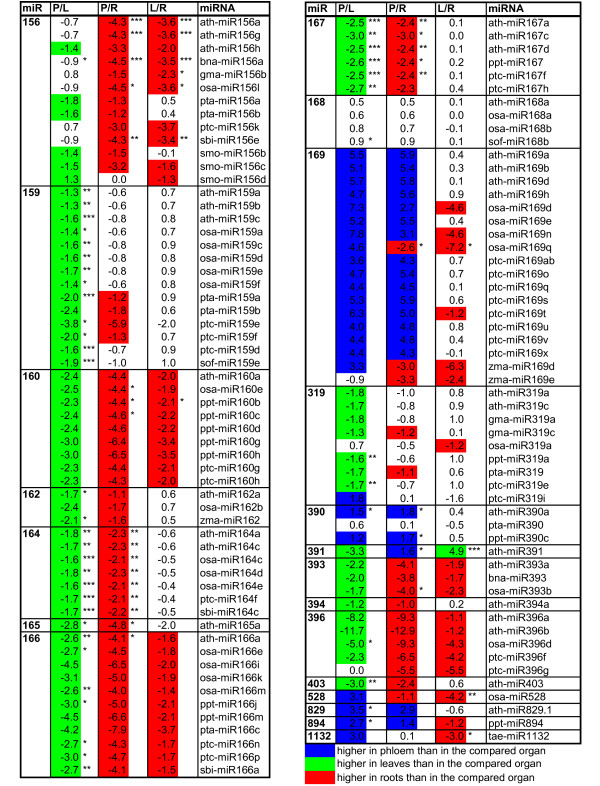
Figure 1.
List of miRNAs that were enriched in phloem, leaves or roots, respectively, in plants grown under full nutrition. Only families where at least one member showed a statistically significant differential accumulation in one organ are shown (p < 0.05, n = 3). Values are log2s between P/L: phloem vs. leaves, P/R: phloem vs. roots and L/R: leaves vs. roots. Markedly (log2 values >1 or <-1, indicating a two-fold difference) phloem-enriched miRNAs are marked in blue, leaf-enriched in green, and root-enriched in red. The statistical significance is indicated as: * p < 0.05; ** p < 0.01; *** p < 0.001.

