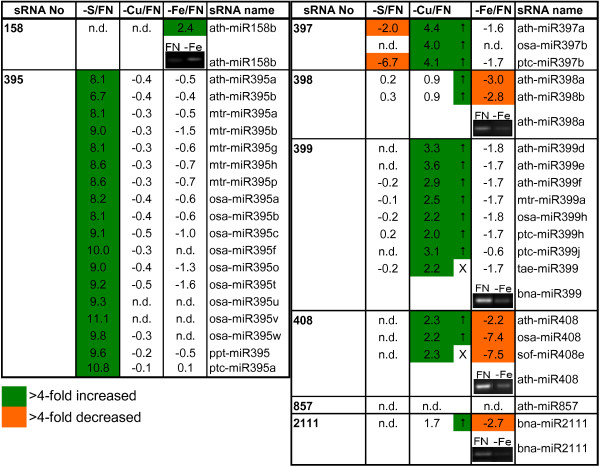
Figure 3.
List of nutrient-responsive sRNAs. List of sRNAs that showed a strong positive reaction to S, Cu or Fe deprivation, respectively, shown as log2 values of stressed vs. FN samples. Only sRNAs that fulfilled the criteria described in the Methods section (positive response, log2 >2 in one of the stress treatments, signal value >100 in FN or deprived sample) in at least one of the comparisons are listed. The insets show results obtained by miRNA sqRT-PCR (after 25 cycles) from an independent experiment. To allow a better overview, values for known nutrient starvation-responsive miRNAs (398 and 857 for -Cu and 2111 for -P) were included, although they only showed a negative response or were not detectable. Arrows indicate directions of changes obtained in a second, independent -Cu experiment. n.d.: not detectable (both, FN and stress, signal values <100). X: not on chip.

