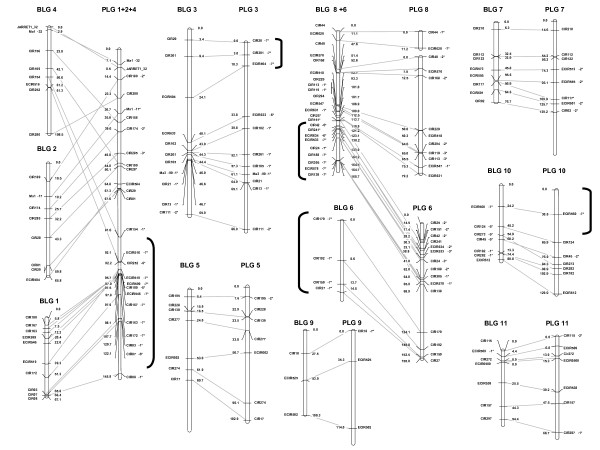
Figure 2.
Map of parents of the F1 Borli population. Linkage group representation displays only anchor markers. Borneo linkage groups (BLG) were defined at LOD3.5 while P. lilin linkage groups (PLG) were defined at LOD 5. For Borneo molecular marker names are on the right side of each linkage group and genetic distances are on the left (cM Kosambi), whereas the marker names are on the left side and genetic distances on the right side of the linkages groups for P. lilin.
Loci labeled with asterisks showed distorted segregation (1* P < 0.05, 2* P < 0.01, 3* P < 0.005, 4* P < 0.001, 5* P < 0.0005, 6* P < 0.0001, 7* P < 0.00005). Brackets] indicate segments with highly distorted markers (P < 0.0001). In SSR names, mMaCIR has been abbreviated to CIR, mMECIR to ECIR.

