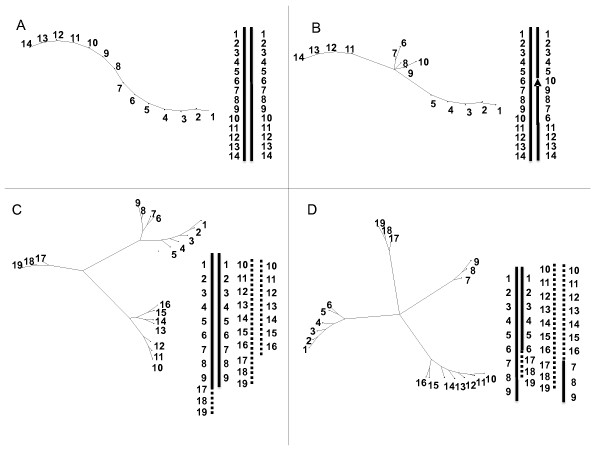
Figure 3.
Graphic representations of structural rearrangements on simulated data. A: one structurally homozygous linkage group with 14 equidistant loci. B: as A but heterozygous for the inversion of segment 6 to 10 C: one non reciprocal translocation between two linkage groups: structural heterozygosity comes from translocation of segment 17 to 19 from linkage group 2 to linkage group 1 D: one reciprocal translocation of segment 7 to 9 from chromosome 1 to chromosome 2

