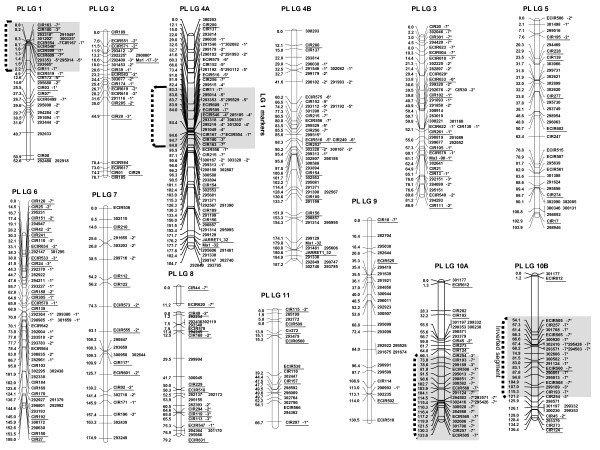
Figure 7.
Putative P. Lilin map built at LOD 5. Molecular marker names are on the right side of each linkage group whereas genetic distances are on the left (cM; Kosambi mapping function). Loci labeled with asterisks showed distorted segregation (1* P < 0.05, 2* P < 0.01, 3* P < 0.005, 4* P < 0.001, 5* P < 0.0005, 6* P < 0.0001, 7* P < 0.00005). Anchor markers are underlined. The 4A and 4B linkage groups represent both chromosomes of the structural heterozygous pair of the chromosome 4. The linkage groups 10A and 10 B represent the both chromosomes of the structural heterozygous pair of the chromosome 10. In SSR names, mMaCIR has been abbreviated to CIR, and mMECIR to ECIR.

